-
Reports Resolutions
 Updated
by MasterChat.io
Updated
by MasterChat.io
The Resolutions report provides details to how fast the conversations are being assigned to users and closed. Understanding the resolution rate helps you to gauge the time spent on resolving customers’ inquiries and to identify any setback in your triage processes.
Resolutions report will be based only on closed conversations. Open conversations will not be taken into account.
Getting Here
Navigate to the Reports module and click Resolutions.
Filters
.png?alt=media&token=831ddb1f-6b21-47e8-9176-bc17b89b9320)
Frequency and date — Select a date range from the drop-down list to be applied to the report. Alternatively, you can define the date range by frequency. The following options are available:
- 1.Today
- 2.Yesterday
- 3.Last 7 Days
- 4.Last 14 Days
- 5.Last 30 Days
- 6.This Month
- 7.Last Month
+Add Filter — You can refine the view of the report components by adding more filter(s). The following filters are available:
- 1.Conversation Closed Source
- 2.First Assignee
- 3.First Response By
- 4.Last Assignee
- 5.Closed By Team
- 6.Closed By User
- 7.Conversation Category
- 8.Conversation Opened Channel
- 9.Conversation Opened Source
- 10.Contact Type
- 11.Contact - Search the Contact by Contact name and Contact ID. Use Contact filter to see the conversations for the specified Contact.
- 10.Conversation ID - Get the conversation ID from the Conversation List to see the performance of the particular conversations.
Clear All — You can use this option to reset the filters to the default selections.
You may encounter a chart with the following message displayed:
- The selected filter(s) are not applicable here: This means the filter(s) you have selected are not applicable to the chart.
- The selected filter(s) have no applicable data: This means no data is available for the selected filter(s), for e.g. the chart is new and only available at a date later than the selected date range.Report Components
Average Resolution Time
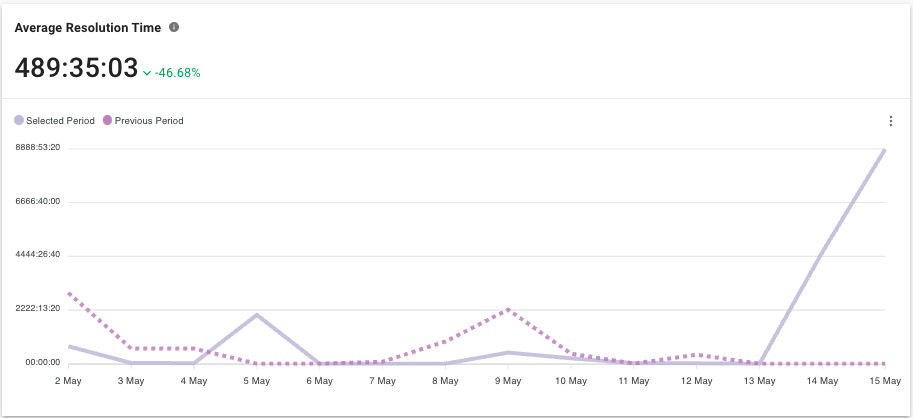
Metric
The average amount of time taken to close a conversation from the time the conversation was opened.
Line Chart
Compares the average resolution time for the selected period with data from the previous period.
Resolution Time Breakdown
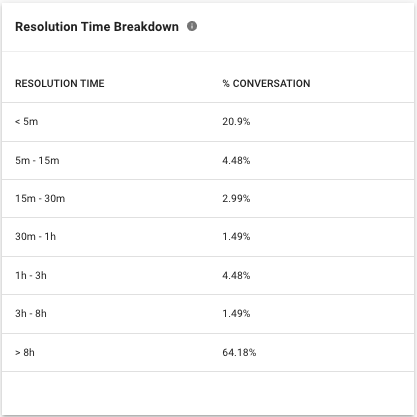
This table shows the breakdown of the conversations that are closed within the selected period by the resolution time of the conversations.
- Resolution Time - Values are grouped by the following ranges: <5min, 5m-15m, 15m-30m, 30m-1h, 1h-3h, 3h-8h, >8h.
- % Conversation - The percentage of conversation where the resolution time falls within that range.
Average First Assignment to Close Time
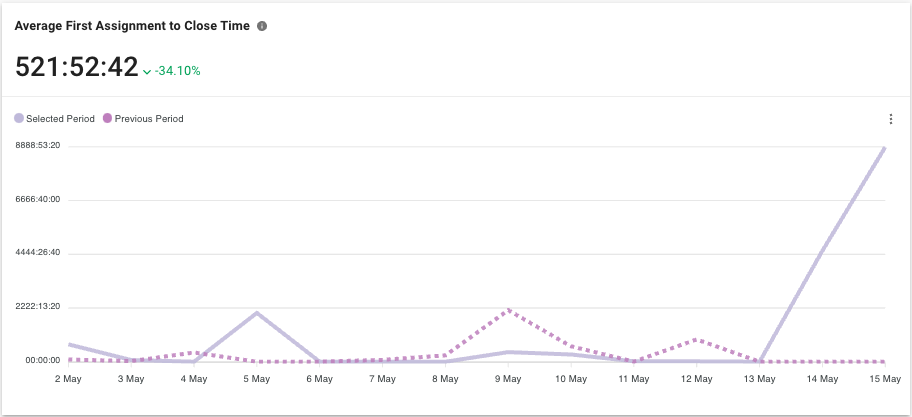
Metric
The average amount of time taken to close the conversation from the time the conversation was first assigned. Also called Resolution Time based on First Assignment, this metric does not take into account the waiting time for an open conversation to be assigned to the first user.
Line Chart
Compares the average amount of time taken to close the conversation from the time it was first assigned to a user for the selected period with data from the previous period.
First Assignment to Close Time Breakdown
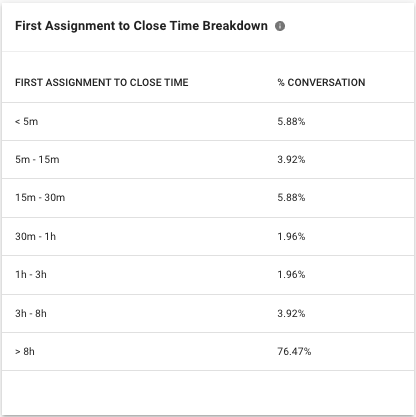
This table shows the breakdown of the conversations that are closed within the selected period by the first assignment to close time of the conversations.
- First Assignment To Close Time - Values are grouped by the following ranges: <5min, 5m-15m, 15m-30m, 30m-1h, 1h-3h, 3h-8h, >8h.
- % Conversation - The percentage of conversation where the first assignment to close time falls within that range.
Average Last Assignment to Close Time
Metric
The average amount of time taken to close a conversation from when the conversation was assigned to the last user. Also called Resolution Time based on Last Assignment, this metric helps managers to analyze the average resolution time of the conversation from when the last agent was assigned and excludes the time of prior reassignment.
Line Chart
Compares the average amount of time taken to close the conversation from the time it was last assigned to a user for the selected period with data from the previous period.
Last Assignment to Close Time Breakdown
This table shows a breakdown of the conversations that are closed within the selected period by the last assignment to close time of the conversations.
- Last Assignment To Close Time - Values are grouped by the following ranges: <5min, 5m-15m, 15m-30m, 30m-1h, 1h-3h, 3h-8h, >8h.
- % Conversation - The percentage of conversation where the last assignment to close time falls within that range.
Average Time to First Assignment
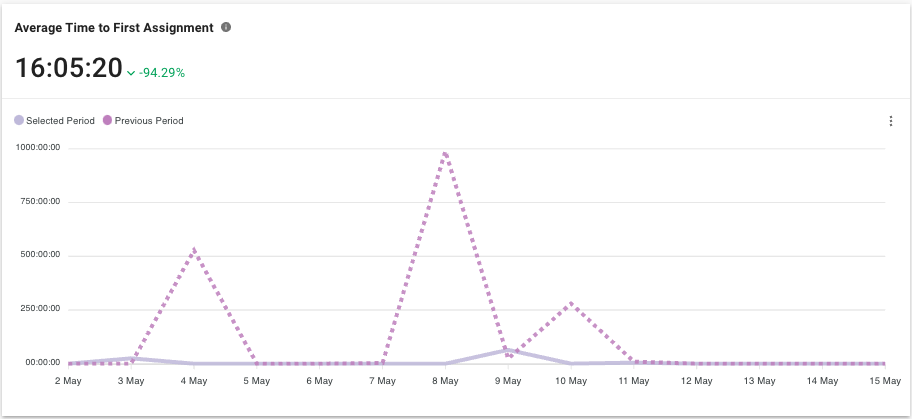
Metric
The average amount of time taken to assign the conversation to the first user. This helps you to understand if your inbound conversation process is efficient in routing conversations to users as quickly as needed, without leaving Contacts waiting for too long.
The data include assignments done manually by user, and automatically by Workflows, Bot, Developer API and Zapier.
Line Chart
Compares the average amount of time taken to assign a conversation to the first user for the selected period with data from the previous period.
Time to First Assignment Breakdown
This table shows the breakdown of the conversations that are closed within the selected period by the time to first assignment of the conversations.
- Time To First Assignment - Values are grouped by the following ranges: < 30s, 30s - 2min, 2 - 5min , 5 - 10min, 10 - 30min, 30 - 1h, >1h.
- % Conversation - The percentage of conversation where the time to first assignment happened within that range.
Average Number of Assignments to Close
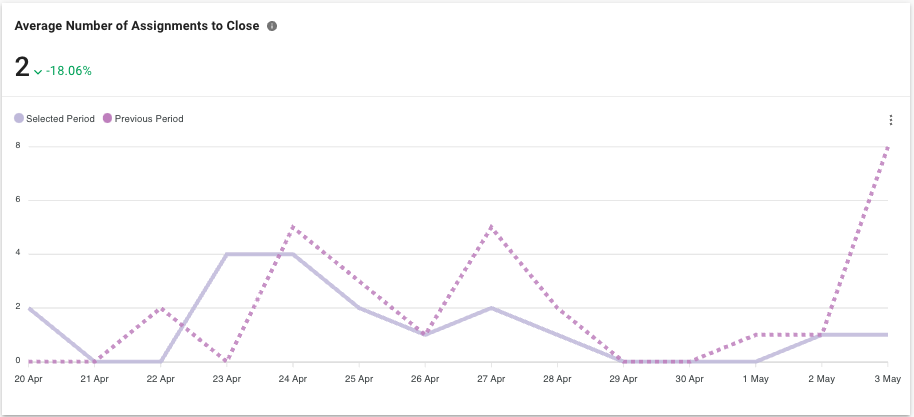
Metric
The average number of assignments in a closed conversation. This helps manager understand if assignments are done accurately overall. For most businesses, the lesser number of assignments or reassignments means the conversations are assigned to the right agent that could assist in handling customers’ issue. This could reduce the resolution time which in turn result in higher customer satisfaction.
Line Chart
Compares the average number of assignments that occurred until the conversation is closed for the selected period with data from the previous period.
Number of Assignments to Close Breakdown
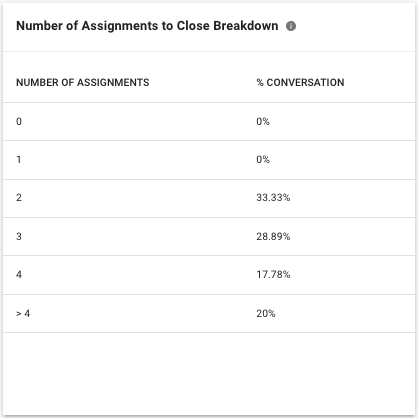
This table shows the breakdown of the conversations that are closed within the selected period by number of assignments of the conversations.
- Number Of Assignments - Values are grouped by the following ranges: 0, 1, 2, 3, 4, >4.
- % Conversation - The percentage of conversation where the number of assignments falls within that range.
Conversation List

Here are the insights you can gain from each conversation that occurred.
Reports table has a limitation of generating a maximum of 10,000 row of results. If you need more data, consider using Data Export.